sae.py

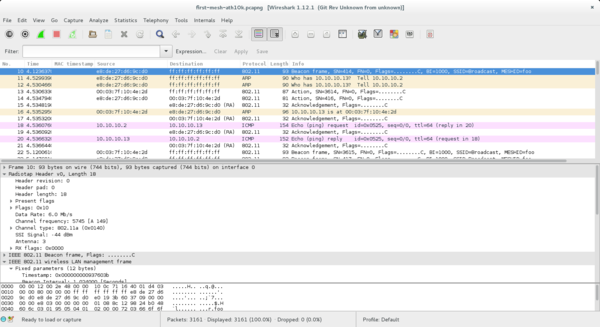
For a while now, I’ve wanted an easy way to decrypt a mesh packet capture when I know the SAE passphrase. This would be quite handy for debugging.

I reasoned that, if I knew the shared secret, and had captured the over-the-air exchange, it should be possible to make such a tool, right? We know everything each station knows in that case, don’t we?

So I spent a bit of time last week reimplementing SAE in python to come to grips with its various steps. And I found my reasoning was flawed.

Similarly to Diffie-Hellman, SAE exchanges values that include the composition of a random value (we’ll call them r1 and r2) with some public part P, in such a way that it is hard to extract r1 even if you know P (e.g. r1*P and r2*P with ECC, although this is not exactly how SAE is specified). These values can be used by each peer to arrive at a shared secret provided they know the original random number (e.g., something like r1 * r2 * P). The crucial point is that r1 and r2 cannot be determined from the exchange alone. They exist only in memory on each peer during the exchange.

So if the secrecy doesn’t actually depend on the password, what is it there for? The answer is authentication: SAE is a password authenticated key exchange (PAKE). The password ensures that the party we are talking to is who we think it is, or at least someone who also knows the password. In the case of SAE, P is derived from the password.

As for the original goal, what we can do instead is use the CCMP keys from a wpa_supplicant log and decrypt frames with those. That is not nearly as convenient, though.

And thus my postings for 2015 are at an end; happy new year, all!

Fake SNRs

With the addition of per-link signal levels that I added over the weekend, my wmediumd fork leveled up from “mere curiosity” to “potentially useful someday.” For the case of mesh, this means you can use signal levels to inform how HWMP will create the mesh paths.

For example, as a test I was able to validate this fix, by setting up a virtual 4-node mesh with a bad path and a good path. With the patch reverted, the bad path was almost always selected due to its PREQs being received at the target first. [In actuality, this test will exhibit frequent path swapping because the order in which the PREQs are received is essentially random, a finding in “Experimental evaluation of two open source solutions for wireless mesh routing at layer two” by Garroppo et al. Wmediumd doesn’t show this yet because frames are mostly received and queued in-order. At the time of the patch, I validated it in an actual 15-node mesh.]

There are still a couple of things that would be nice to have here. Today, we base the decision on whether a multicast frame is received by the signal level from the transmitter to us and the multicast rate. However, this means that with a low multicast rate, there is basically zero frame loss. In real life, loss happens much more frequently, and so we cannot test the effects of lost path request frames in wmediumd, which is the subject of at least one pending HWMP patch. Another problem is that the current setup works only with static setups; we might be interested in what happens with mobile nodes, for example. For that we’d need to be able to change the signal level periodically; how to easily specify that is a bit of a question mark.

tmux + wmediumd

Wmediumd gained the ability to do a simple contention simulation a while ago. It turned out to be a small change to the existing code: just ensure that any new frames are scheduled after any other queued frames of equal or higher priority from any other station.

Assuming the simulation is accurate, we might use this to gather some information about different kinds of wireless network topologies. For example: what is the throughput and latency like for a mesh network, as a function of hops?

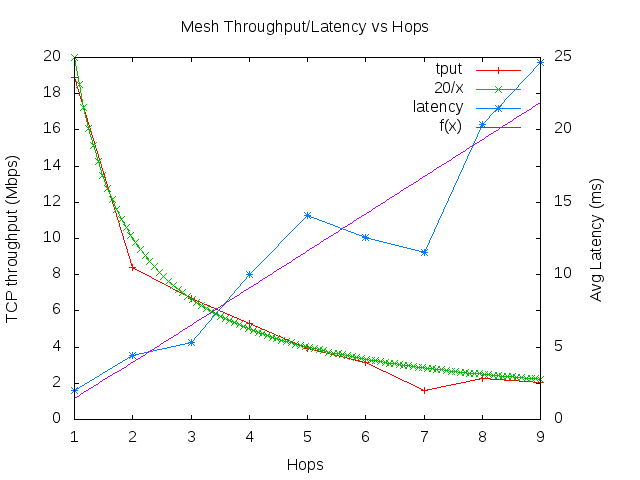
The one sticking point is that it’s a bit of a pain to set up a bunch of mesh nodes with hwsim with their own IPs and routing tables. I’ve previously scripted this with send-to-self routing, but it’s a bit ugly. So I looked into doing this with network namespaces and controlling it all with tmux. The result is this fairly minimal script to launch a number of mesh nodes in a linear toplogy. From there one can easily run ping and iperf to gather some data, as in this chart:

This image shows the result, and is in line with measurements that Javier Cardona had done on actual hardware. We can see that throughput is roughly inversely proportional to the number of nodes, while latency is directly proportional.

This may seem pretty bad at first, but makes sense when you consider that a radio transceiver can only listen or talk at once — it is all about radio physics, nothing to do with mesh specifically (which is not to say that mesh has no inefficiencies). Also this level of performance is when all the nodes are in range of each other; in such a case you’d be unlikely to have so many hops because the nodes would instead just peer directly with each other. So we might design our networks to avoid many hops, reduce the number of nodes in a given interference area, use fancy phy algorithms to enhance spatial reuse, or use multiple channels.

My plan with wmediumd is to use it in a bit more automated fashion to evaluate things like changes to HWMP — I think if we can identify topologies that people care about then it’s a bit stronger to say “this change always makes things better” if we can show repeatable before-and-after results from wmediumd.

Weekend updates

More updates to speccy pushed to github this weekend. It gained the ability to toggle on-and-off line and scatter plots. Also, it now takes care of enabling spectral scan and then scanning channels (by exec()-ing iw, naughty me) so you can just tell it the device and it does the rest. Code is still ugly but gradually taking shape. There’s an animated gif for those that want to see what it currently looks like in operation.

I settled on (somewhat inefficiently) smoothing the line graph with a centered moving average using a 5-sample window length, which met the strict theoretical basis of “it looked kind of right.” I did not yet incorporate the time-based plot I was playing with.

It could certainly be faster. Profiling shows that the vast majority of time is spent drawing 9-pixel rectangles in Cairo. I suppose that even if Cairo was using an accelerated backend, which I don’t believe it is in my case, that this would be something more efficiently done by rendering to a client pixmap anyway. Lots of low-hanging fruit everywhere, but I’m resisting the urge to really optimize anything at this early stage.

Nicer serialAlso yesterday I finally cleaned up the somewhat messy serial port installation on one of my ath10k routers with the help of a drill. These cheap cables work well but do require a bit of attention with the glue gun — I find the plastic case around the USB port / converter board is always coming un-snapped and falling off otherwise.

time vs frequency

This is roughly what I had in mind for the time/frequency plot for my little spectrum visualizer. Time is on the y-axis and frequency on the x-axis. There are some interesting artifacts here, especially on the higher channels. Probably bugs in my implementation, but we’ll see as I develop it further.

Speccy with labels

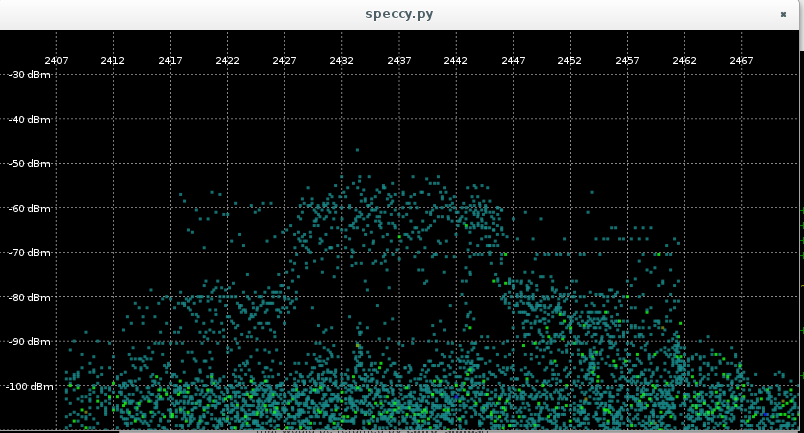
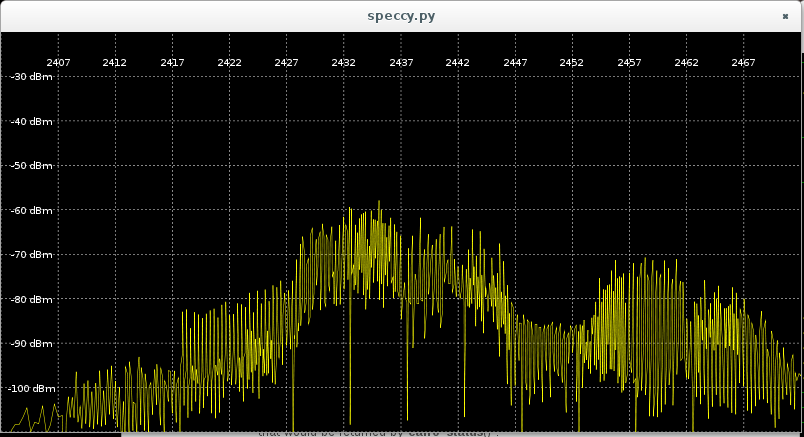
I messed around with “speccy” a bit today to see what I could do with it to make it look slightly nicer. It really needed a grid so one can more easily see the frequencies and power levels. So now it looks like this:

(This is with iperf running on channel 6 to a nearby AP).

I have in mind a couple of other visualizations. An obvious one is to show the overall max or average power level rather than a scatter plot. This would be a cleaner display, although there could be co-channel interference sources you wouldn’t see that way. Here’s a first cut at that:

I am doing some averaging for multiple (~8) samples with the same subcarrier frequency, but clearly more smoothing is needed. Also I notice that I occasionally get some artifact where all the subcarriers have the exact same power level. Not sure what that is, but it wants filtering.

Another interesting visualization would be a scrolling chart of frequency vs time, with power level indicated by pixel intensity. Then you could get an idea of historical changes in the medium. (Oh hey, the neighbors are watching Netflix now.)

The code is still an ugly pile of hacks, which it will probably continue to be until I decide just what kind of processing needs doing on the raw samples. Sorry for that.

VHT mesh

…is a thing now.

# iw dev
phy#0
    Interface wlan0
		ifindex 4
		wdev 0x1
		addr 30:b5:c2:fb:34:d8
		type mesh point
		channel 149 (5745 MHz), width: 80 MHz, center1: 5775 MHz

# iperf -c 192.168.1.20
------------------------------------------------------------
Client connecting to 192.168.1.20, TCP port 5001
TCP window size: 43.8 KByte (default)
------------------------------------------------------------
[  3] local 192.168.1.21 port 34175 connected with 192.168.1.20 port 5001
[ ID] Interval       Transfer     Bandwidth
[  3]  0.0-10.0 sec   148 MBytes   124 Mbits/sec

DWM-W034 UART

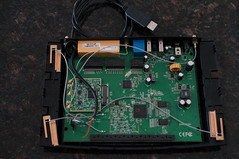
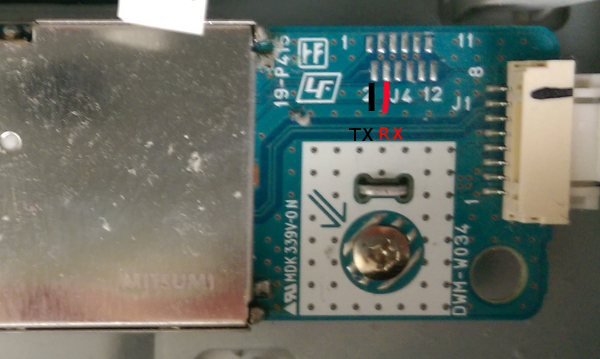
In response to my previous post about UART access on the Alfa AWUS036NHA, I got a nice email from Jim Ewing about the DWM-W034, an ath9k_htc device that apparently is embedded inside HDTVs and readily available for $10. He found the TX/RX pins on the board, and it looks like it would be a bit easier to put a socket on one of these compared to the Alfa since there are no pesky chips nearby.

With his permission, and so that this information doesn’t get lost to the sands of time, here’s the pic he sent me. Enjoy!

mesh on ath10k

I’ve had my ath10k AP (TP-Link Archer C7 v2) since last October or so, with the goal of having a VHT-capable device with which to test (currently non-existent) VHT mesh. Unfortunately, for nearly all of that time, I’ve been stuck on a firmware crash shortly after bringing up the device. Not that I’ve spent a whole lot of time on it, but there’s only so much one can do when getting to the point of “firmware crashes and it has something to do with peers but that’s all I know and I don’t have the time, tools, or code to dig deeper.”

I think there’s some variant on rubber duck debugging where you complain publicly about some issue, and doing that makes you think about it more, and then the way forward is magically revealed. That, plus some helpful hints from the residents of the ath10k ML, got me over the hump, so now it works!

Next up, finding a spare mini PCIe slot for the other ath10k device I have, and getting the VHT bits done…

serialized

router += serialMy ath10k-based router now has serial headers, after I managed to crash it a few times over the weekend while testing out some patches. Thank you, TP-Link, for making the pins so easily accessible, to the extent that it’s easier to whip out the soldering iron than remind oneself how to setup kexec/kdump.

I do need to get one of these nifty usb-serial cables so that the JTAG ribbon cable + FTDI-breakout-on-a-breadboard monstrosity can go back into the
parts bin, but it is working fine otherwise. [The pictured 7-segment display and TTL chips are just misdirection, by the way.]

There was a momentary bit of confusion on my part when the console showed the router stuck in a loop requesting recovery firmware over TFTP instead of the normal boot process…until I realized that the reset button was wedged in the depressed state by the case. Whoops.