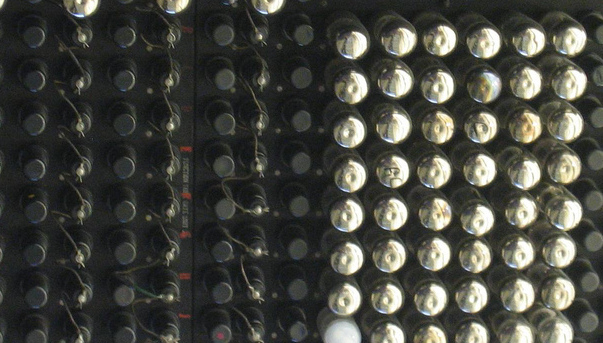
This is roughly what I had in mind for the time/frequency plot for my little spectrum visualizer. Time is on the y-axis and frequency on the x-axis. There are some interesting artifacts here, especially on the higher channels. Probably bugs in my implementation, but we’ll see as I develop it further.
