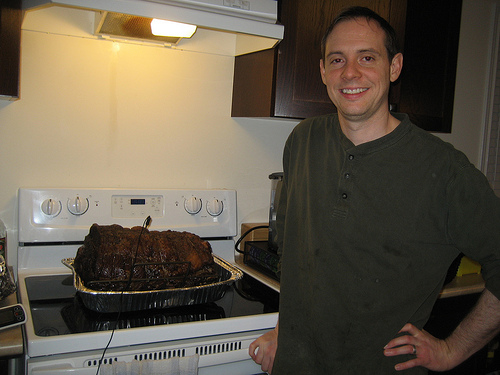
Over the winter holidays I was put in charge of cooking one (of several) of the family dinners. At my house, a Christmas dinner can mean only one thing: prime rib is on the menu. The local grocery store had a great deal on rib roasts, so I bought a whole one. All seven ribs, 25 pounds of it. When it came time to cook this beast, I did plenty of reading, and settled on this seriouseats recipe. I guessed at about six hours to slow-roast the behemoth. But after a few hours of roasting, I decided it would be nice to know whether it would finish in time for the guests, or whether we would have to invent some pre-meal activities to stall.
Linear regression to the rescue! I had a leave-in meat thermometer plugged into the slab of cow, the type with a cable that runs outside the oven so that you can read the temperature without opening the oven door. It was then a simple matter to record the temperature every fifteen minutes and plot it to see how it was going. My uninformed guess was that the temperature curve is really sigmoid-shaped, but linearity is probably close enough around the target range.
Gnuplot can do linear regression for you:
f(x) = a*x + b
fit f(x) 'temp.dat' u 1:2 via a, b
set xrange [-5:160]
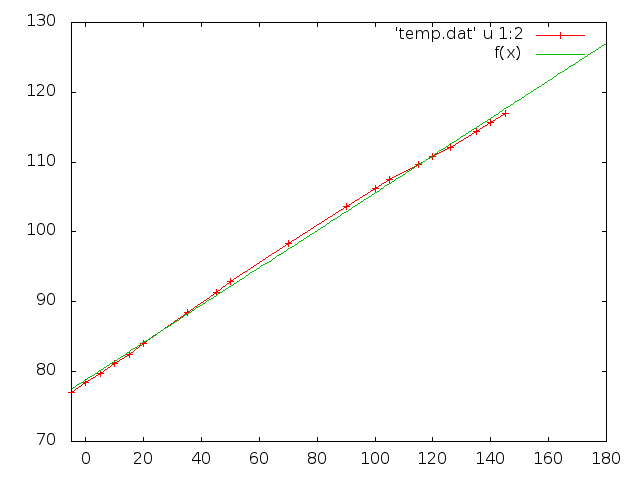
plot 'temp.dat' u 1:2 w linespoints, f(x)
This produces a graph like the image below, which shows that after 3 hours of cooking, the meat would be around 128 degrees (I started keeping track about three hours in).
In the end, I turned up the oven a bit in the last hour to speed things along. The meat turned out great, although I didn’t have too much luck with the in-between rest that the recipe promotes: there were still plenty of juices all over the place at carving time. Next time, I believe I’ll just turn the oven up to 500 deg. F when the interior target temperature is reached, and then do a normal rest afterwards. Another lesson learned: a full rib roast is perhaps twice as much as needed for eight people, but I am not one to complain about having prime rib leftovers for a week.