The ath9k and later chips support a spectral scan feature for measuring channel occupancy. I played with it for the first time last week over the Thanksgiving holiday. Simon Wunderlich’s FFT_eval is a great tool to look at the captured RF spectrum, but I found myself wanting something more real-time, and the various other things I found on github with that aim didn’t work for me. So, this too-ugly-to-live python hack happened.
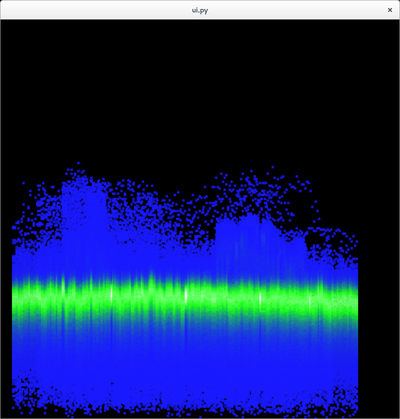
It turns out that the samples are rather coarse and infrequent, so the result is not as dynamic as I’d hoped. However, I made the pretty heatmap below with a few hours’ worth of samples, and although I didn’t yet label frequencies, you can see a couple of channels in active use. There’s still plenty of room for improvement in the visualization.